For investors examining Apple (AAPL +0.18%), it's critical to understand how the technology giant's devices are selling, and the calculation that perhaps best expresses the health of Apple's products is their average selling price (ASP).

Image source: Apple.
Apple's overall ASPs have trended downward in recent quarters. What does that mean for Apple investors today? Let's review Apple's ASP metrics and see how the figure drives Apple's broader financial performance.
Inside Apple's ASP
A product's ASP is the revenue from its sales divided by the number of units sold in a single period.
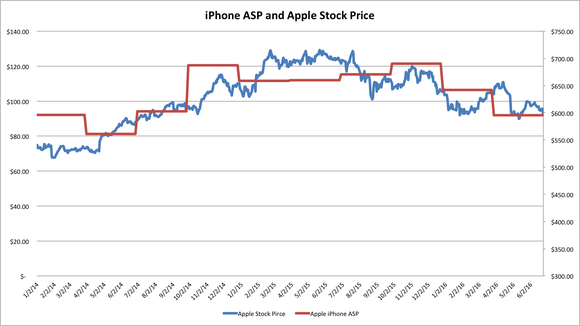
For product-driven companies like Apple, ASP calculations provide pivotal information about its financial performance and, by extension, the performance of its stock price. In fact, there's a clear relationship between Apple's iPhone ASP and its stock price movements:

Image sources: Apple investor relations and Yahoo! Finance.
The iPhone accounts for the majority of the tech giant's revenue and profit. In Apple's most recent quarter, the iPhone segment alone produced $24.1 billion of the company's $42.4 billion in sales -- about 57%. Moreover, the iPhone's share of Apple revenue exceeds two-thirds of total sales in some quarters following new device handset launches.
And the iPhone's ASP matters even more when you begin considering how each device drives overall profitability. Apple consolidates its operations under a single profit-and-loss statement, meaning investors can't tell how costs such as marketing and R&D are spread among the company's various products. Since the iPhone has the highest gross margin in Apple's device family, though, it's safe to assume that the device generates the lion's share of Apple's profits. That makes the iPhone crucial in determining Apple's overall financial performance each quarter.
Apple's ASP outlook
Keeping in mind that the iPhone, iPad, and Mac -- the three devices for which Apple provides individualized data -- are at different phases of their product life cycles, here's how ASPs changed in Apple's most recent quarter.
|
Apple Average Selling Price (ASP) by Product |
Q3 2016 |
Y-o-Y % Change |
|---|---|---|
|
iPhone |
$595 |
(9.8%) |
|
iPad |
$490 |
18% |
|
Mac |
$1,232 |
(2%) |
Data source: Apple Investor Relations.
If the iPhone figure alarms you, here's some context. The financial impact of the 4-inch iPhone SE landed during the quarter, and since the base 16 GB version retails for $399 -- $250 less than the introductory price for the 16GB iPhone 6s -- a decline in Apple's ASP was almost inevitable. CFO Luca Maestri said as much on Apple's conference call, though he said he expects iPhone ASPs to improve during the current quarter.
Looking further out, the anticipated debut of the iPhone 7 next month, and perhaps a radically redesigned 10th-anniversary iPhone in late 2017, seem likely to drive a renewed interest in Apple's more expensive, and profitable, handsets. So I think concerns about a prolonged decline in iPhone ASPs seem overblown.
As for Apple's other core devices, the iPad and Mac, the iPad continues to struggle for meaningful volume growth, with unit sales falling 9% in Q3. However, the introduction of the higher-priced 12-inch iPad Pro has helped bolster iPad ASPs in the face of that weakness.
It's unclear how much the iPad Pro has affected Mac sales. With small updates to the Mac lineup in recent quarters, it could be that consumers are waiting on the sidelines. In any event, investors will want to watch the shipment data in Apple's third largest reporting segment in the coming quarters. However, both the iPad and Mac divisions pale in comparison with the iPhone, so investors would do well to focus the bulk of their efforts on the ASPs in Apple's largest division.
