Image source: Getty Images.
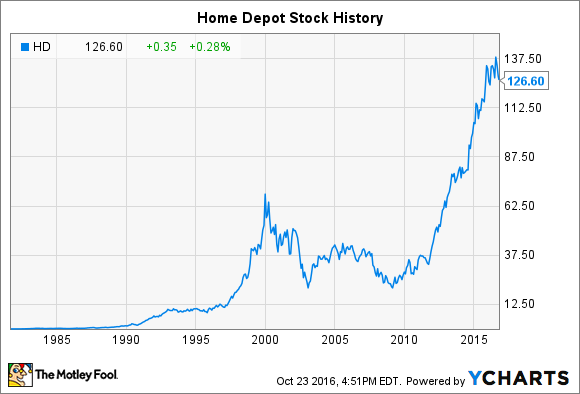
Home Depot (HD 0.93%) stock has been one of the best long-term investments of the past 40 years. The company that helped jump-start the home improvement industry has absolutely trounced the average stock market returns since its IPO, and its more recent outperformance shows Home Depot can continue to deliver superior returns. Let's take a look at how Home Depot stock has performed throughout its history and whether the company is poised for even more gains in the future.
Home Depot share price history
Home Depot was founded in 1978 by now-billionaires Arthur Blank and Bernie Marcus, along with help from banker Ken Langone and merchandising expert Pat Farrah. After nearly a year developing its first store, Home Depot opened its first two locations in Atlanta the following year.
From its inception, Home Depot placed an emphasis on the customer. In fact, Blank and Marcus envisioned their home-improvement stores being staffed by avid DIYers whose job would be to help customers of all skill levels complete any project rather than salespeople simply hoping to make another sale. This potent combination of business concept and innovative approach to service produced results that speak for themselves, as you can see from this graphic provided by the company.

Image source: Home Depot.
Home Depot conducted its IPO on September 22, 1981, trading at that time on the Nasdaq under the ticker symbol HOMD. Its shares entered the market at $12 per share, though Home Depot also conducted stock splits on nine separate occasions in the intervening years. This means one share of Home Depot at the time of its IPO has increased to 45.4 shares today. This rapid increase in share count combined with the 10 times increase in Home Depot stock's price per share translates into a truly unbelievable 493,000% return, and that doesn't factor in the extra compounding power for investors who reinvested their dividends.
Home Depot's investment outlook today
Today, Home Depot is a large, mature company. However, it would be a mistake to assume that the home-improvement stock can't keep delivering strong returns for its shareholders for years to come. Here's a quick chart of Home Depot's current key investment metrics.
|
Company Name |
Market Capitalization |
P/E Ratio |
Dividend Yield |
|---|---|---|---|
|
Home Depot Inc. |
$158 billion |
21.5x |
2.1% |
Data source: Google Finance.
It might surprise investors to learn that the company hasn't opened a new store in the past three years and has no plans to do so in 2016. Despite this same-store sales growth has easily outpaced that of its key rival Lowe's, thanks to savvy integration of its e-commerce offerings and its efforts to attract professional craftsman.
More impressive yet, Home Depot's investment thesis isn't solely predicated on its top-line growth. In recent years, Home Depot's management has sharply focused on cost controls. For example, the company projects that its costs will grow at a mere 32% percent of its sales growth rate, which translates to impressive operating leverage driving disproportionately large gains in profit growth. Case in point: Home Depot's 2016 guidance calls for 5% sales growth and 16% profit growth. Looking to the future, the average of sell-side analyst estimate calls for Home Depot to compound its earnings per share at a 13.4% annually for the next five years. Now, that's the sign of a high-quality business.
Given Home Depot's impressive business model, it should come as no surprise that its stock doesn't seem like an obvious bargain today. However, the company's price-to-earnings ratio does still sit slightly below the 24 times P/E ratio of the S&P 500. The company hasn't maintained a perfect streak of dividend growth, but its 2.1% dividend yield and flexible balance sheet certainly leave room for future dividend increases and stock buybacks. In fact, it's hard to point out a glaring defect in Home Depot's investment prospects, making it a fantastic option for investors to consider adding to their stock portfolios today.


