How would you like to own shares of 500 of the biggest companies traded on U.S. stock exchanges in one fell swoop? That's what you get when you invest in the S&P 500 index, which tracks the performance of 500 of the largest stocks weighted by market cap that trade on the Nasdaq and the New York Stock Exchange (NYSE). And, you can profit handsomely from such an investment: The average annual return for the S&P 500 is close to 10% over the long term.

The performance of the S&P 500 index is better in some years than it is in others, though. Here's how the S&P 500 index has performed in recent decades -- and why it's an attractive option for many investors.

Man standing on one coin, looking out to larger and larger stacks of coins ahead.
Image source: Getty Images.

S&P 500 annual returns

Over the past 30 years, the S&P 500 index has delivered a compound average annual growth rate of 10.7% per year.

Data source: Slickcharts.com.
Year S&P 500 Return
1992 7.62%
1993 10.08%
1994 1.32%
1995 37.58%
1996 22.96%
1997 33.36%
1998 28.58%
1999 21.04%
2000 -9.10%
2001 -11.89%
2002 -22.10%
2003 28.68%
2004 10.88%
2005 4.91%
2006 15.79%
2007 5.49%
2008 -37%
2009 26.46%
2010 15.06%
2011 2.11%
2012 16%
2013 32.39%
2014 13.69%
2015 1.38%
2016 11.96%
2017 21.83%
2018 -4.38%
2019 31.49%
2020 18.40%
2021 28.71%

This table underscores one issue with relying on average annual returns. The performance of the S&P 500 index in most years was far from its average return during the period. Throughout most of the 1990s, for example, the S&P 500 delivered returns that were well above its historical long-term average return. On the other hand, during the first decade of the 21st century, the index underperformed its long-term average return.

However, the table also points to why investing in the S&P 500 index over the long run can be rewarding. The index delivered negative annual returns in only five years during the past three decades. In 11 of those years, the S&P 500 index generated annual returns of more than 20%.

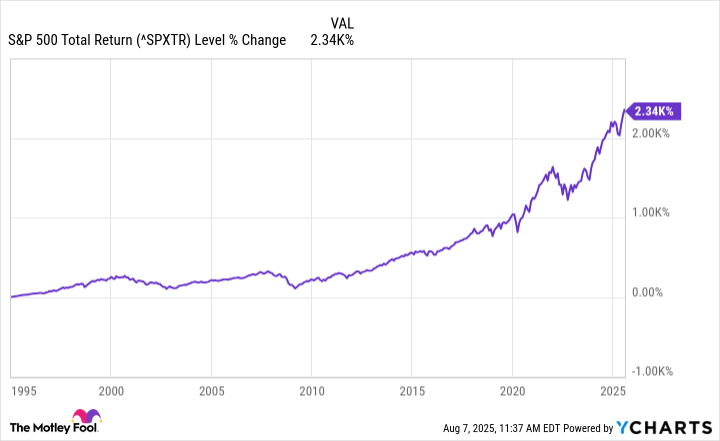
Buying and holding the S&P 500 index over the long run pays off. The following chart shows just how much it's done so over the past 30 years.

^SPXTR Chart
^SPXTR data by YCharts.

If you had invested $10,000 in the S&P 500 index in 1992 and held on with dividends reinvested, you'd now have more than $170,000. The market volatility in 2022 could cause this return to decline somewhat. However, the index has proven to be a winner over the long term.

History of the S&P 500 index

The origins of the S&P 500 index date back to 1923 when Standard Statistics Company created an index consisting of 233 stocks. That stock index was updated weekly. In 1926, though, the company unveiled a daily index that included 93 stocks.

Standard Statistics Company merged with Poor Publishing in 1941, forming Standard & Poor's. In 1957, Standard & Poor's launched the S&P 500 index. It was the first stock market index calculated by a computer.

However, the S&P 500 index wasn't the first stock market index. That honor belongs to the Dow Jones Transportation index, which was created in 1884. This index was followed 11 years later by the Dow Jones Average, which was renamed the Dow Jones Industrial Average (DJINDICES: ^DJI) in 1896.

While the Dow Jones Industrial Average soon became associated with the overall U.S. stock market, it initially included only 12 stocks and was later expanded to 30 stocks. The S&P 500 has given a better picture of the overall U.S. stock market because of its much greater number of stocks compared to the Dow Jones.

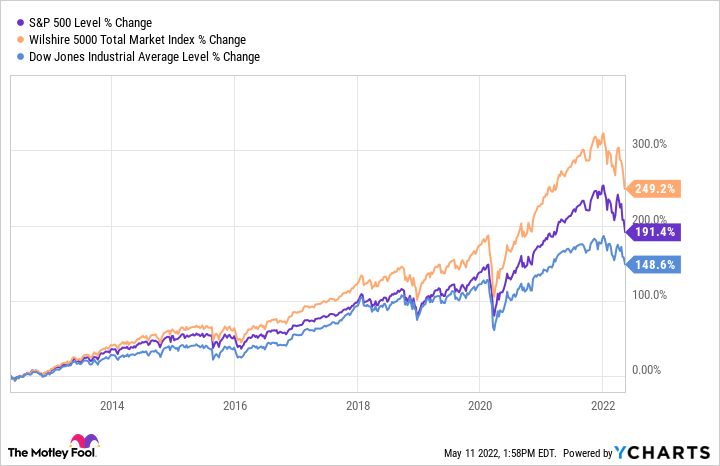
There are other indexes that include even more U.S. stocks. For example, the Wilshire 5000 Total Market Index (NASDAQMUTFUND:WFIVX) consists of all stocks traded on major U.S. stock exchanges. It originally included 5,000 stocks but today has around 3,450 stocks. 

However, the S&P 500 index is more widely known than the Wilshire 5000. And, although it includes far fewer stocks, it tracks overall U.S. stock market returns quite well (and does so significantly better than the Dow Jones).

^SPX Chart
^SPX data by YCharts.

How can you invest in the S&P 500 index?

There are three ways to invest in the S&P 500 index:

  1. Buy shares of all 500 individual stocks.
  2. Buy a mutual fund that tracks the S&P 500 index.
  3. Buy an exchange-traded fund (ETF) that tracks the S&P 500 index.

Investing in each S&P 500 stock individually isn't a very practical approach. That was especially the case before online brokerages that didn't charge for stock trades became popular. For a long time, buying low-cost mutual funds was the best way for investors to track the performance of the S&P 500 index.

Today, several S&P 500 ETFs are available that have very low annual expense ratios (the percentage of the fund's assets that go toward annual fees). The most widely traded of these ETFs include:

Data source: Yahoo! Finance.
ETF Expense Ratio
iShares Core S&P 500 ETF (NYSEMKT:IVV) 0.03%
SPDR S&P 500 ETF Trust (NYSEMKT:SPY) 0.09%
Vanguard S&P 500 ETF (NYSEMKT:VOO) 0.03%

The main difference between buying S&P 500 ETFs vs. mutual funds is that ETFs trade like a stock. You can buy or sell an ETF instantly through a brokerage at the then-current price. Mutual funds are priced daily, and your purchase or sale isn't instantaneous.

Warren Buffett's favorite investment

Billionaire investor Warren Buffett has said that an S&P 500 index fund is the best investment most people can make. In fact, he stated that he wants his wife's money invested in such a fund after he's gone. This investment advice might seem a bit surprising since Buffett is well-known for his stock-picking ability.

First of all, he isn't necessarily saying that it's a bad idea to buy individual stocks if and only if you have the time, knowledge, and desire to do it right. However, most investors don't.

Buying a mutual fund or an ETF that tracks the S&P 500 is easy and quick. It doesn't require the research that investing in stocks with solid growth prospects demands. Investing in an S&P 500 fund (either a low-cost mutual fund or an ETF) guarantees that you'll do as well as the stock market over time. And, over the long term, that performance has been quite good.

Related index fund topics

Keith Speights has positions in Vanguard S&P 500 ETF. The Motley Fool has positions in and recommends Vanguard S&P 500 ETF. The Motley Fool has a disclosure policy.