Beta is a measurement of how volatile a stock is relative to the overall stock market, usually as measured by the S&P 500 index. A beta of two means the stock is twice as volatile as the overall market. A beta of 0.50 means the stock is half as volatile.
If the S&P 500 index rises or falls 10%, you’d expect a stock with a beta of two to move 20%. A stock with a beta of 0.50 would typically move just 5% when the benchmark index moves 10%.
Beta is typically used in risk measurement. Stocks with higher betas are more volatile and riskier than low volatility stocks. Let’s go over how beta works and the pros and cons of using it.

Understanding Beta
As previously mentioned, beta is used to measure how volatile and how risky a stock is. The higher beta is, the more market risk there is in the stock. If a stock has a beta of two, and the market falls 10%, the stock would, theoretically, fall 20%.
Beta is most often used as part of the Capital Asset Pricing Model (CAPM), which is used to measure the cost of equity for a stock. The CAPM formula is:
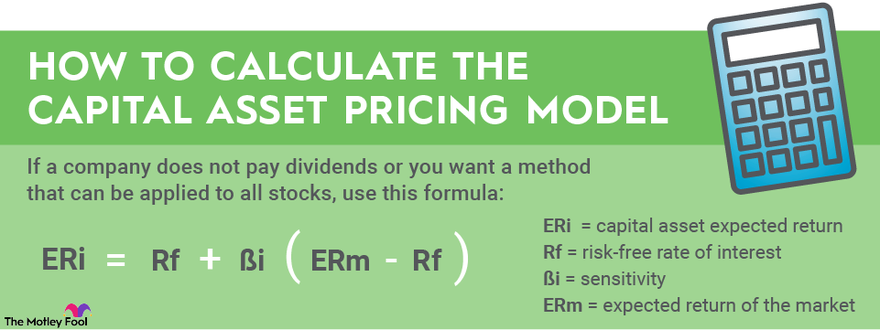
Put simply, the expected return of a stock is equal to the risk-free rate plus beta times the market risk premium. The market risk premium is the expected return of the market minus the risk-free rate.
The CAPM is used to find the cost of equity for a stock when analysts want to determine whether the stock is turning an economic profit as part of the Weighted Average Cost of Capital (WACC) formula and as the discount rate when doing a Discounted Cash Flow (DCF) analysis.
The most glaring drawback of using beta is that it is a backward-looking number. While many volatile stocks stay volatile in the short run, there is no guarantee that a volatile stock will stay that way.
For example, suppose a business had poor management and often flirted with bankruptcy. Now it has new management, pays a nice dividend, and is steadily paying down debt. The company doesn’t have the same level of risk it once did, but its stock may still have the same beta.
There is an opportunity in these types of stocks for investors. If the market is using beta to value the stock when it shouldn’t, the stock may be undervalued.
How to calculate beta
It’s useful to know how beta is calculated to understand it better, but, in practice, you’ll be able to find a stock’s beta on either your broker’s website or any mainstream financial website.
The formula for beta is:
B = Covariance (Re, Rm) / Variance (Rm)
Beta is calculated by comparing a string of historical prices for both the stock and the index.
The pros and cons
Here are a few key pros and cons to using beta:
| Pros | Cons | |
|---|---|---|
| Used in CAPM formula | Backward-looking | |
| Easy to understand | Only measures systematic risk | |
| Useful for assessing a portfolio | Volatile metric |
Pros
Used in CAPM formula
Beta is used in the Capital Asset Pricing Model, which is a useful tool for finding the current cost of capital for a stock. Cost of capital is necessary for calculating discount rates and determining whether a stock is turning an economic profit.
Easy to understand
Beta is easy to understand. More than one means the stock is more volatile than the index; less than one means it is less volatile. When starting your analysis, you can quickly identify how the market views a stock. A high beta indicates a high-growth stock.
Useful for assessing portfolio
In addition to calculating the beta of individual stocks, you could calculate the beta of your entire investment portfolio. You can do this using the formula above with historical prices for your portfolio or by finding the weighted average beta of your positions.
We don’t recommend attempting to time the market, but if you run your portfolio beta and find that it is significantly higher than one, it may be time to invest in stocks that provide more diversification, such as some low-volatility value stocks. If the market were to turn downward, your portfolio could be in for more pain than necessary.
Cons
Backward-looking
The famous quip about beta on Wall Street compares it to the turkey who has a beta of one its whole life until the day before Thanksgiving.
While beta measures how volatile a stock has been relative to the index, that doesn’t guarantee it the same level of volatility in the future. Take the beta measurement with a grain of salt, and keep both historical performance and current factors in mind.
Only measures systematic risk
Beta only shows a stock’s systematic risk, i.e., the risk to the stock if the total market falls. There are unsystematic risks as well, such as having too much debt, losing a big lawsuit, or slowing consumer demand. Each of these risks could cause the stock price to fall even if the market is going up.
Volatile metric
If you calculate the beta of a high-flying growth stock right after the company reports gangbuster earnings, it will likely be higher than if you had calculated it six weeks earlier during a dead period.
Related investing topics
The bottom line
Beta is a useful tool for quantitative investors. The more qualitative your analysis tends to be, the less useful beta will be for you.
Additionally, the longer term your investment horizon is (and we want it to be as long as possible), the less useful beta will be. If you’re investing in a business and counting on it to produce good returns 10 years from now, it doesn’t matter how volatile it was in the past 12 months.


